Two approaches to hydrogen electrolysis
When does wasting energy pay off?
In an earlier post, I talked about the ‘two types’ of batteries: those with high capital costs and high roundtrip efficiency suited to daily cycling, and those with low costs per kilowatt-hour (kWh) of capacity but low roundtrip efficiency best suited for infrequent cycling applications.
This pattern is generalizable: when utilization of an asset is low, the ‘inefficient’ process with lower upfront capital costs can be more cost effective overall.
This is relevant because solar and wind generation have two key characteristics:
Their cost is declining precipitously (~$15-30 per MWh and falling in key regions)
Their effective utilization is low (~20-25% for PV in sunny regions; ~40-55% for wind)
As a result, processes that can be run off low-utilization cheap renewable energy (particularly solar) can potentially beat higher capex processes run at higher utilizations. This shift to a renewable-powered industrial stack has the potential to create a step change in renewable energy deployment, but will require a rethinking of how we use that energy (as Casey Handmer outlines more extensively here).
Take two prospective hydrogen electrolysers: X and Y
X requires ~$1,000 in equipment costs1 per kilowatt (kW) of capacity, but can produce a kilogram (kg) of hydrogen with just 50 kilowatt-hours (kWh).
Y only requires ~$70 in equipment spend per kW, but needs ~80 kWh to produce a kg of H2.
Put simply: X is more expensive upfront, but less expensive to run.
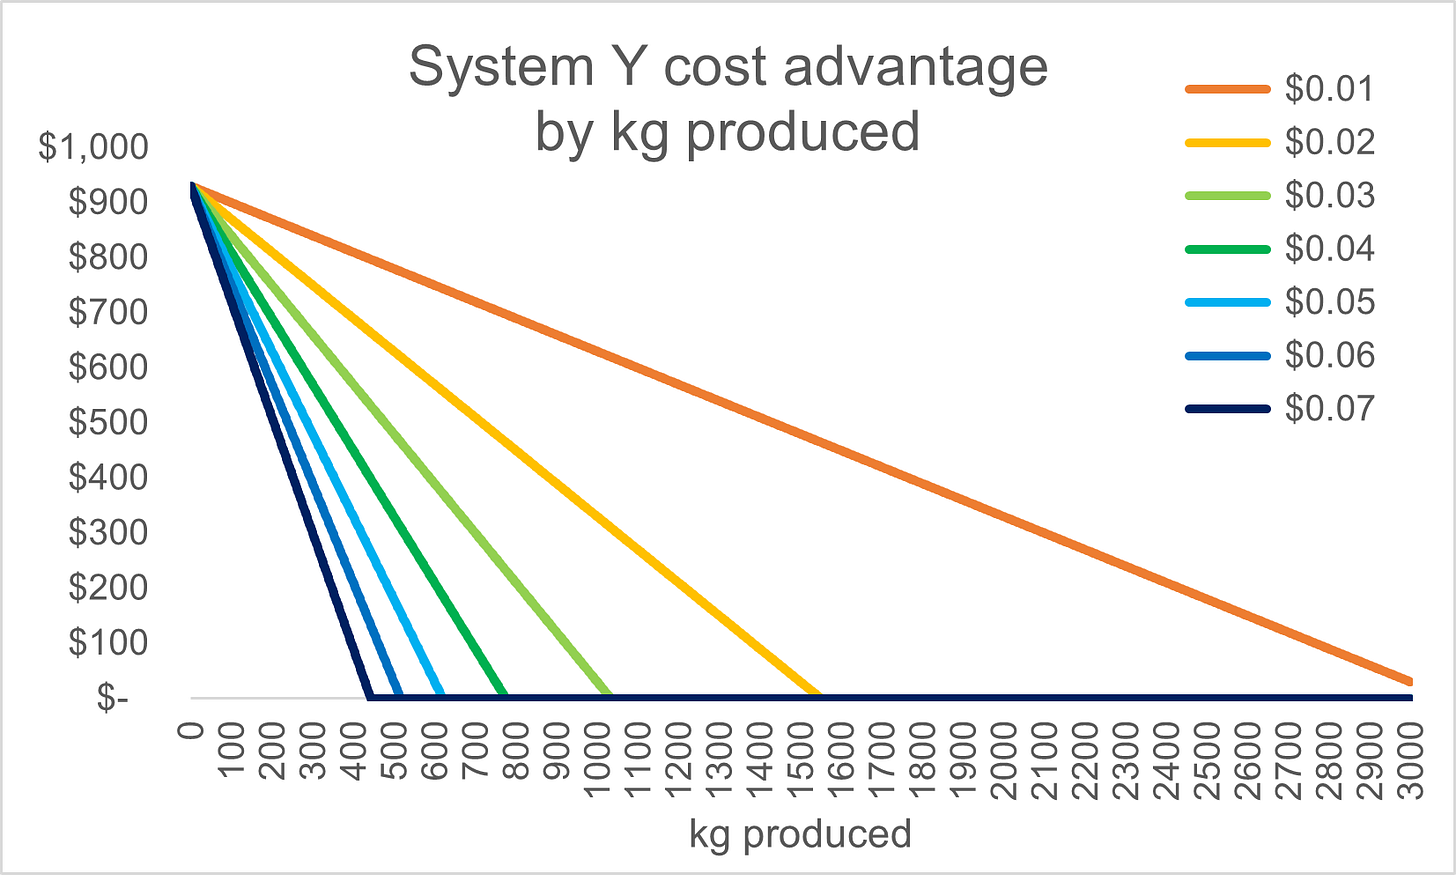
So, under what conditions will system X be better? Given different energy cost assumptions, we can calculate how many kilogram’s of hydrogen must be produced before we are indifferent between the two approaches (and after which system X is better).
If we can procure energy at ~$0.04 per kWh, the two systems would reach cost equivalency after ~775 kg of hydrogen production (the darker green line in the chart).
At ~100% capacity factor (i.e. all 8,760 hours every year), we would expect a 1 kW version of System X to produce this in ~4.4 years, and a similar size System Y to produce it in ~7.1 years2.
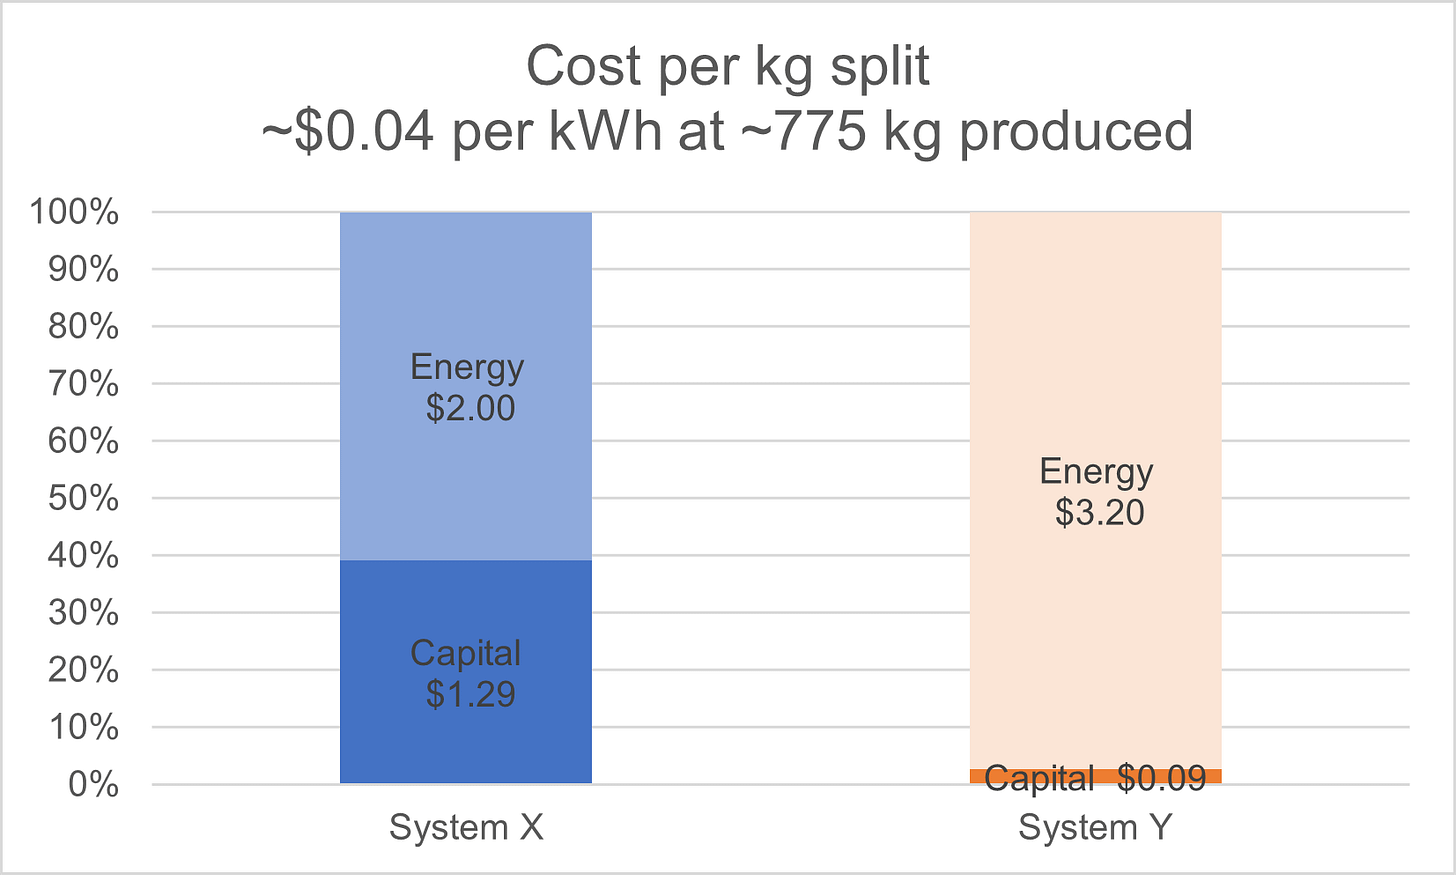
At that production volume and energy cost, the breakdown of spend across the two approaches is:
Thereafter, System X would be producing power more cost effectively at ~$2.00 per kg in energy costs versus system Y’s ~$3.20 in energy costs.
Under these assumptions, System X is pretty obviously superior.
The wrinkle is this: it is challenging to procure energy for ~$0.04 per kWh from anything other than intermittent renewables (e.g., wind and solar). The use of renewables is also a pre-requisite for qualification for the maximum green hydrogen tax credits under the Inflation Reduction Act (IRA)3.
With this context, two things need to change about this scenario:
The capacity factor drops (e.g., ~20-25% for solar PV, ~30-55% for onshore wind4)
The potential energy costs could be even lower (~$0.02-0.04 per kWh and falling)
With this, we can start to understand how sensitive the comparison is to specific assumptions.
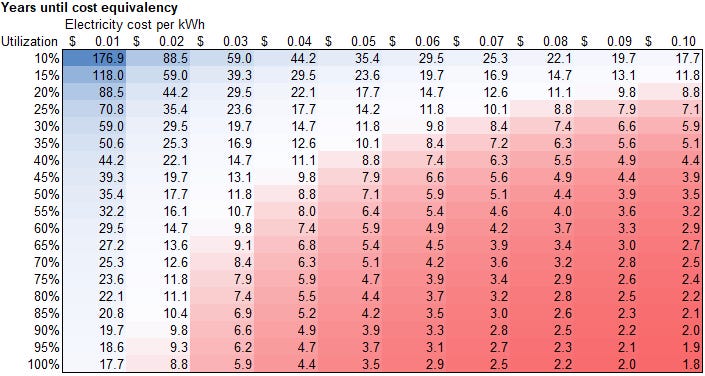
In the below, we see the # of years5 for costs to equalize based on potential utilization % and cost per kWh, with the red cells indicating shorter timelines (system A wins faster) and blue cells indicating longer timelines.
In general, any scenarios under which System X takes more than 15 years to ‘win’ is in effect a win for System Y once one factors in capital costs6 and market uncertainty.
We can take our toy model one step further7 and gesture at financial returns.
So let’s say we have access to energy from an incremental wind farm with a ~55% capacity factor at ~$0.024 per kWh. This is low cost, but within reason for the United States today (before subsidies).
At this price and capacity factor, over a 20 year system life we’d expect to generate hydrogen at a cost of ~$1.72 per kg for System X and ~$1.98 for System Y. If we’re able to sell our hydrogen for ~$3 per kg, we’re earning ~$1.28 per kg from System X and ~$1.02 from System Y respectively.
Another win for System X right?
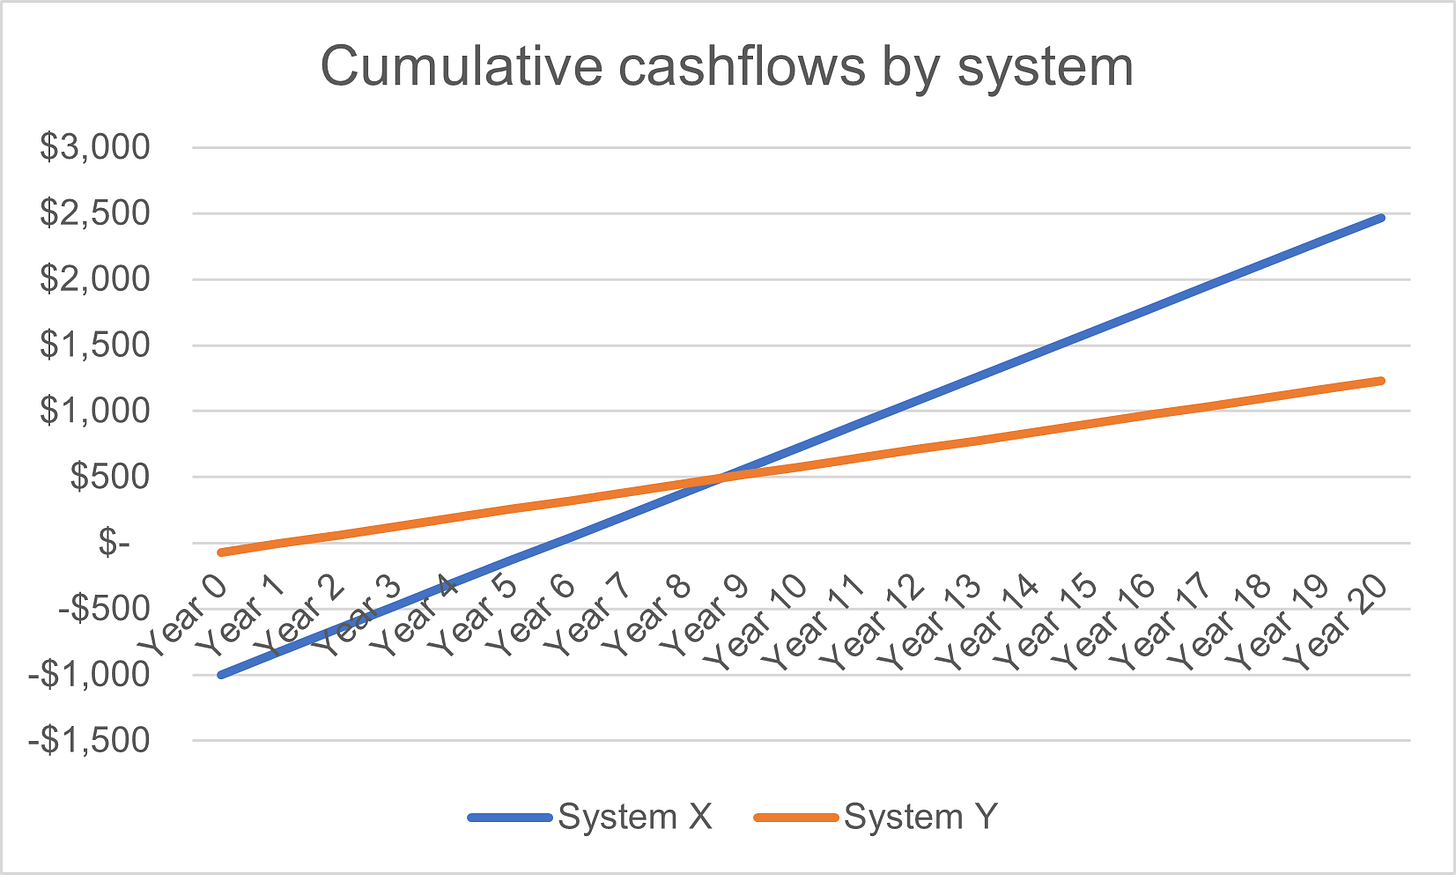
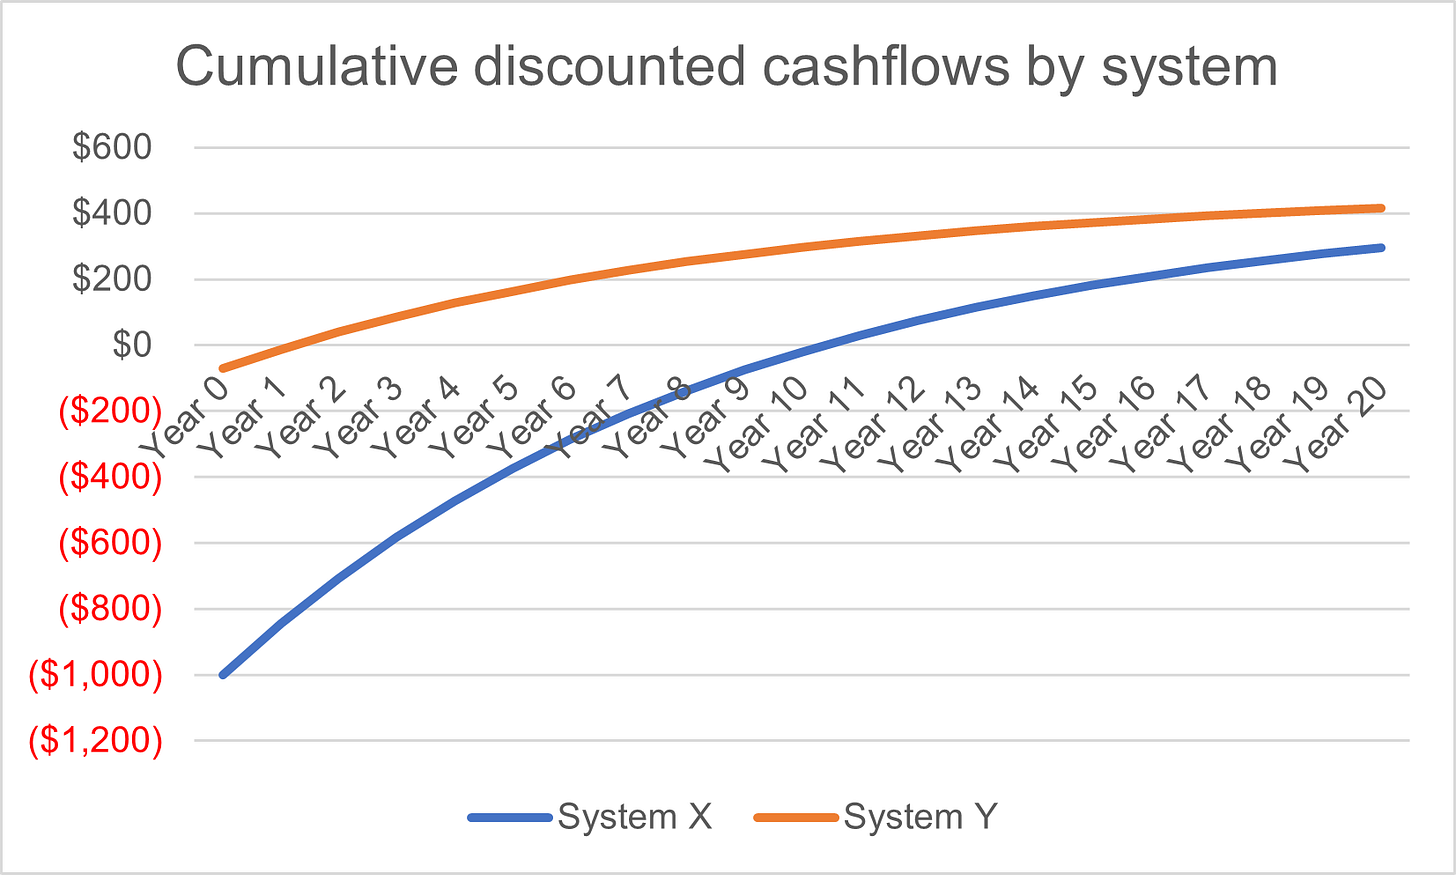
Well, this is where the financial aspect comes in. From an pure cashflow perspective, for a given energy input and capital spend, System X pulls ahead around year 8.
But, once we discount these cashflows at ~12% to reflect a rough cost of capital, we find that System Y outperforms due to it’s capital light approach.
So, if I had a stranded wind farm (for some reason), I’d hook it up to System Y and get cash now rather than later.
To the extent one believes that energy costs will continue to fall, particularly for low-capacty-factor solar, this implies that the System Y approach will ultimately win out.
This matters, because big $$ are flowing into ‘green hydrogen’ production, and it is not obvious all the relevant stakeholders have internalized the ongoing cost declines of input energy. This will have a big impact on which projects will ultimately be cost competitive (particularly given the lack of forward purchases confirmed so far).
That said, this is great news for hydrogen end-users and the ultimate. Less expensive approaches to electrolysis, predicated on the intermittent availability of cheap renewable energy, will help pave the way to a low carbon future one way or the other.
We’re making a lot of simplifying assumptions around degradation, replacement costs, and ongoing O&M to illustrate the broader dynamic.
Given the lower energy efficiency of the Y process, each kW of capacity of system Y produces hydrogen more slowly than an equivalent kW of system X.
As of this writing, the rulemaking is looking to come out on the side of hourly matching of clean energy generation with evidence of incrementality to qualify for full tax credits, though this is being actively lobbied over.
A mixed system could get you higher (e.g., ~50-60%), but given the incrementality requirements that starts to involve overbuilding and needing to either curtail (which hurts cost effectiveness) or feed into the grid (or other applications) which could slow the project down meaningfully.
Based on the operational speed per kW of system X of ~50kWh per kg.
I’ve not included the effect of discount / hurdle rates in any of these calculations. To the extent these are factored in, it would make System Y look more appealing (all else equal) because its higher energy costs happen over time versus System X’s higher upfront costs.
Potentially past breaking point, but I believe the conclusions are directionally correct without needing to include a step change in modelling complexity.

